These profiles summarize the input sequence length distributions that drive prefill pressure, cache reuse opportunity, and replay behavior. Use them as visual shorthand when choosing a trace shape for planning runs.
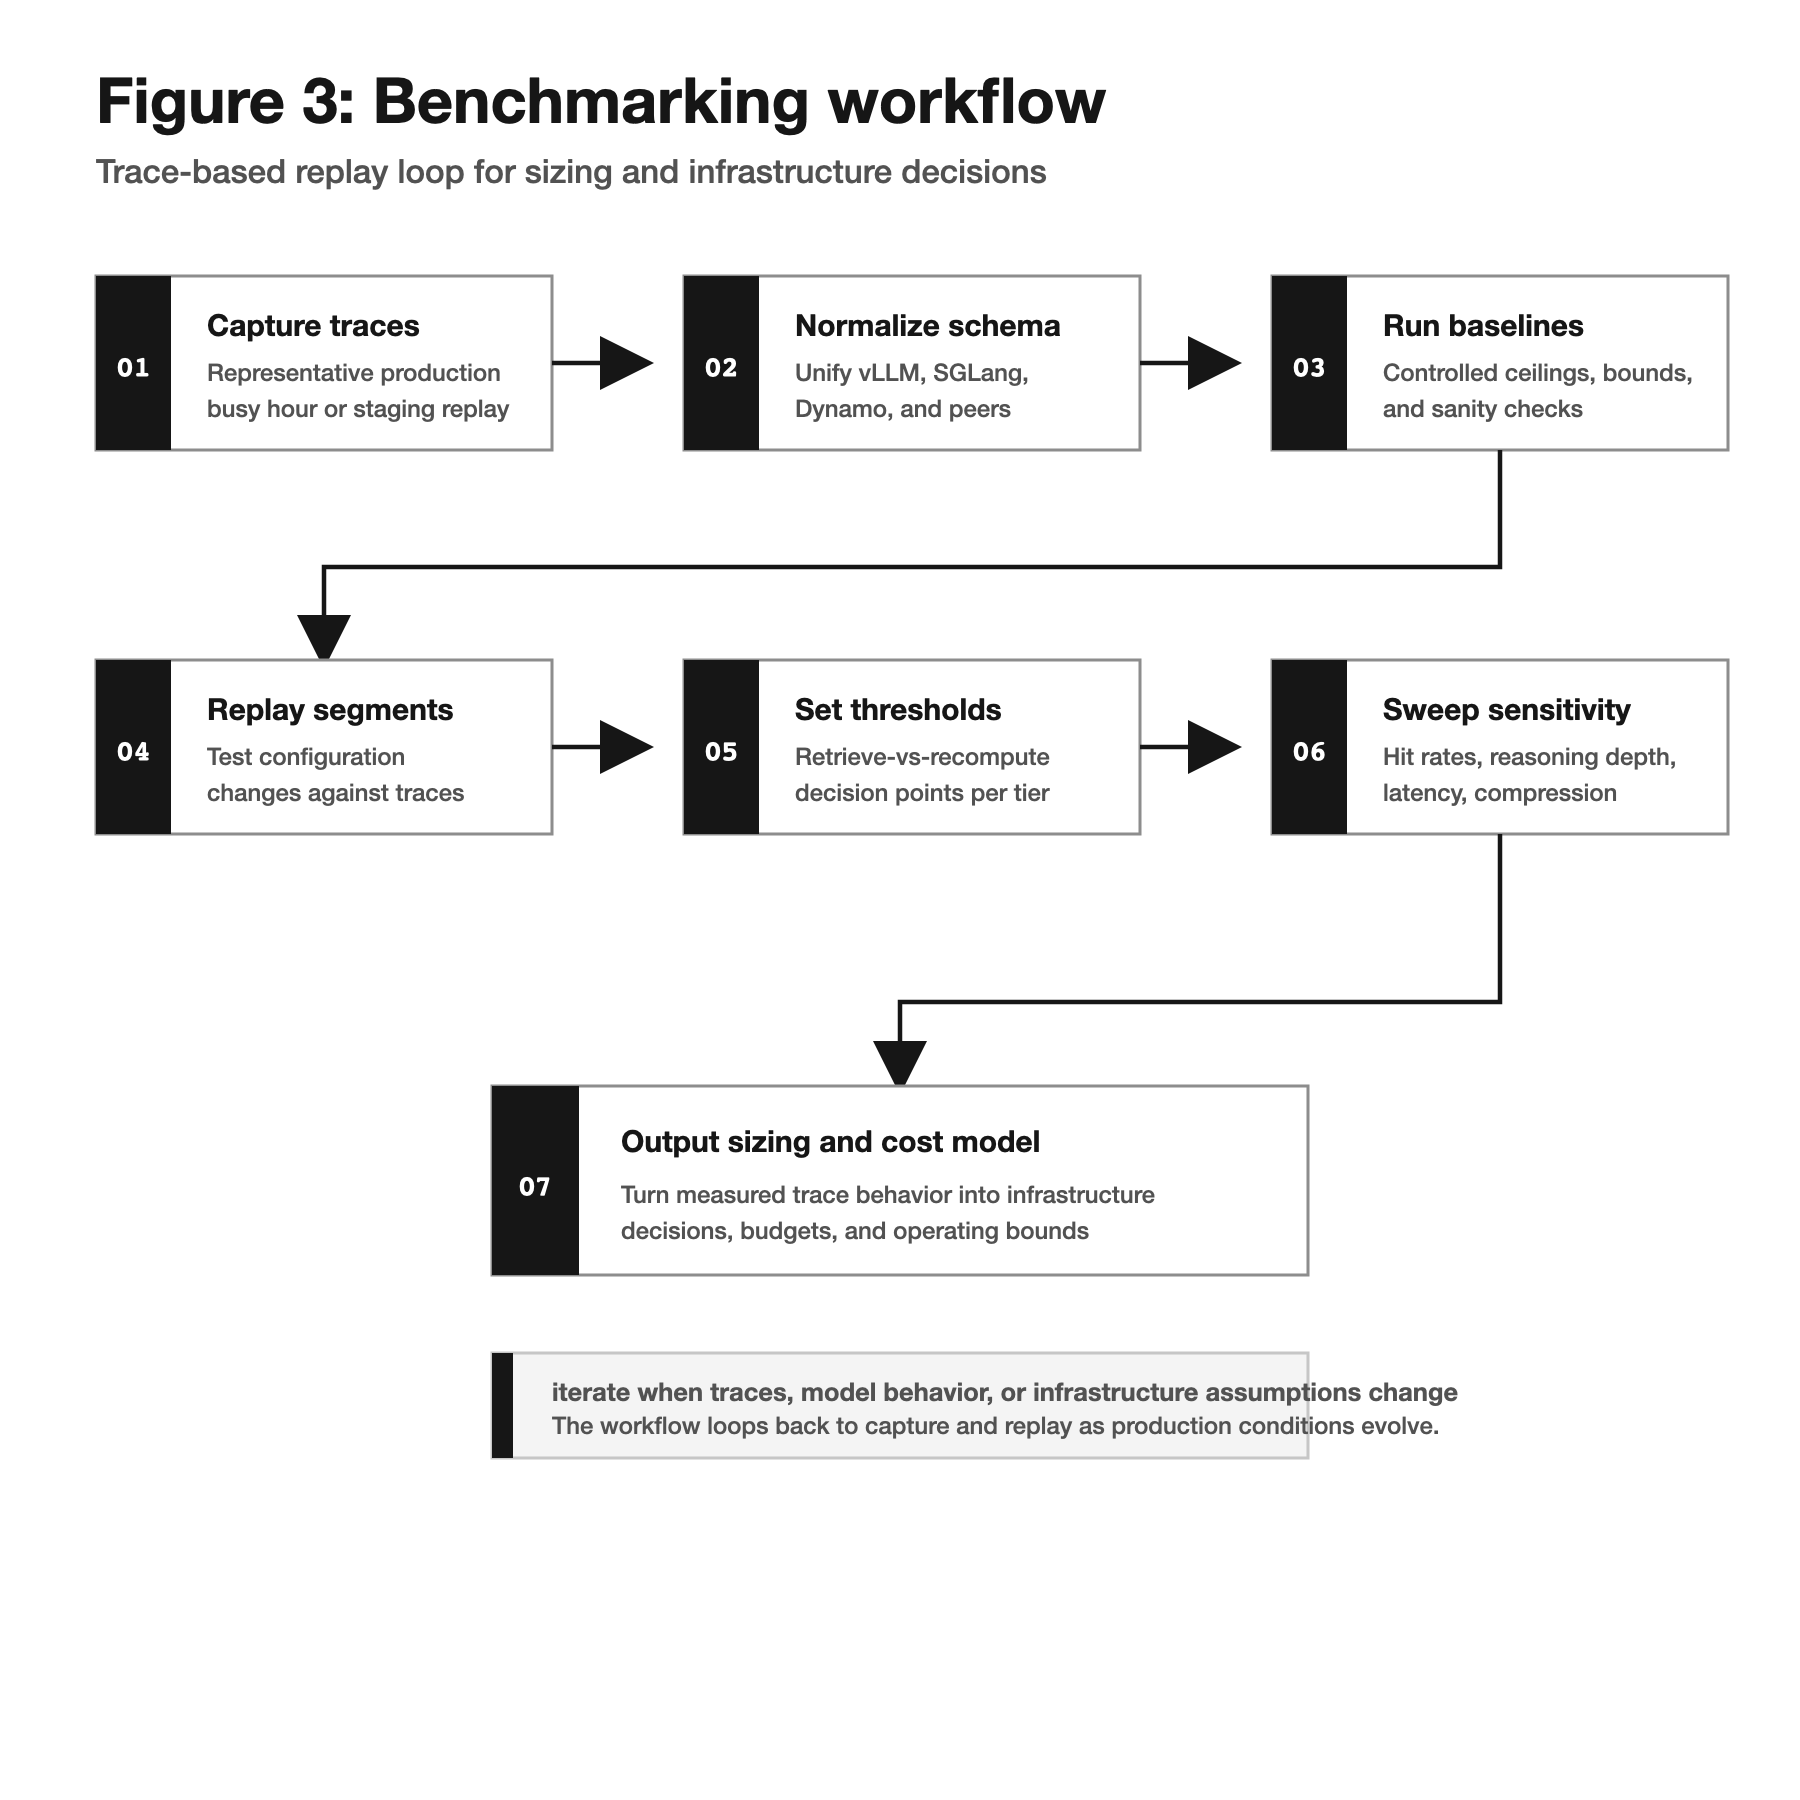
Figure 3
Benchmarking workflow
Benchmarking starts with representative traces and ends with sizing guidance that can survive configuration, cache-tier, and network sensitivity changes.
Efficiency model
Effective efficiency
Successful output volume only tells part of the story. The useful throughput signal has to be divided by all of the system costs that consume the run envelope.
Effective efficiency drops as memory, network, storage I/O, and power costs expand around accelerator time.
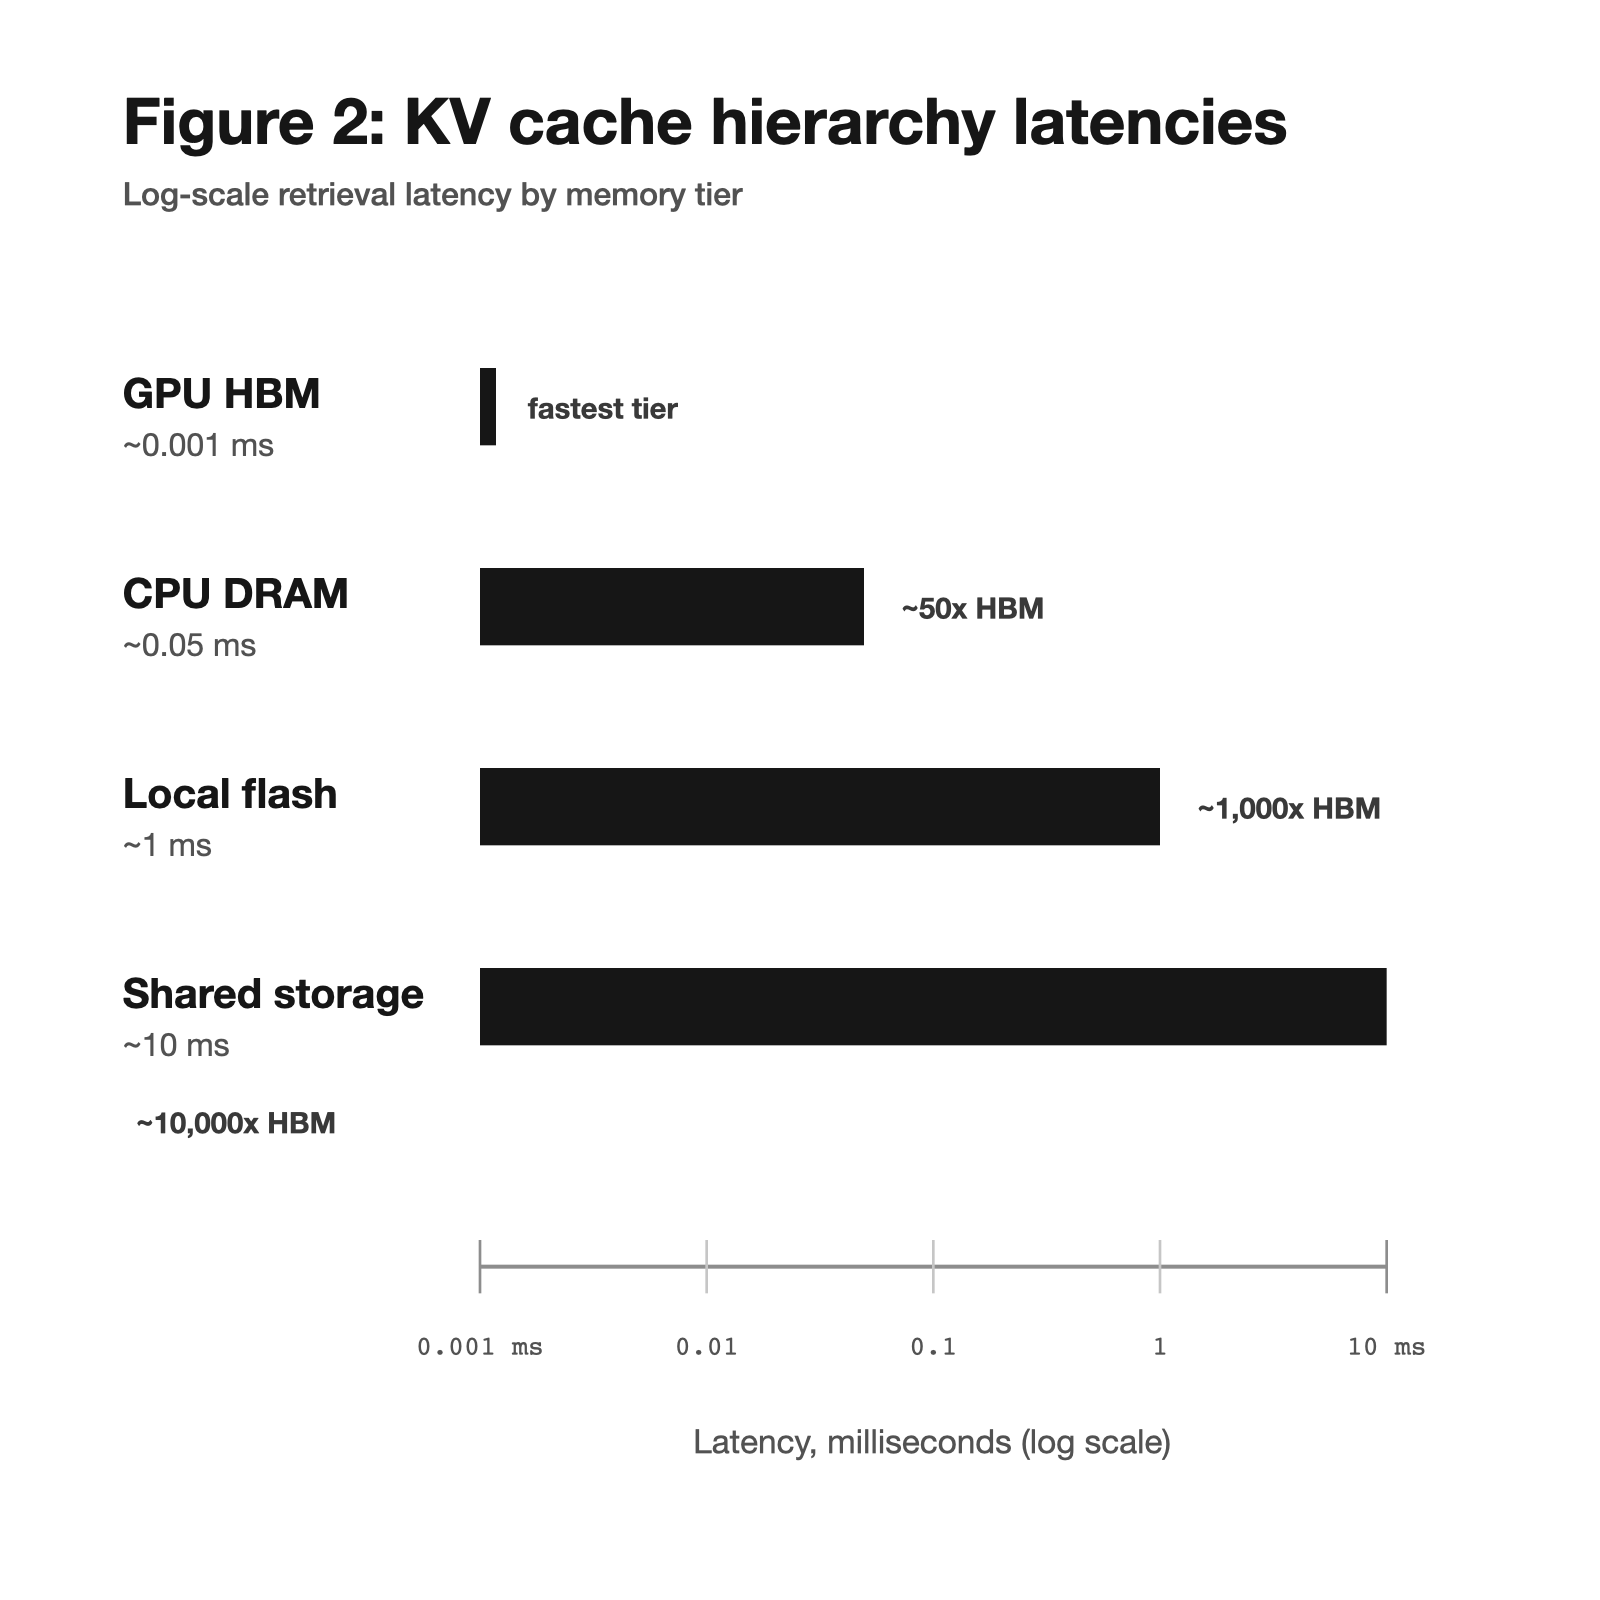
Figure 2
KV cache hierarchy latencies
Retrieval speed versus recompute becomes the dominant decision once state leaves HBM.